Imshow
imshow is great for seeing how a 2D function will respond to parameters, or for tasks like thresholding an image. If you want to look at a slices of a precomputed array you should consider using hyperslicer which was created for exactly that purpose.
[ ]:
%matplotlib ipympl
import matplotlib.pyplot as plt
import numpy as np

from mpl_interactions import ipyplot as iplt
[ ]:
x = np.linspace(0, np.pi, 200)
y = np.linspace(0, 10, 200)
X, Y = np.meshgrid(x, y)


def f(param1, param2):
    return np.sin(X) * param2 + np.exp(np.cos(Y * param1)) + param2
[ ]:
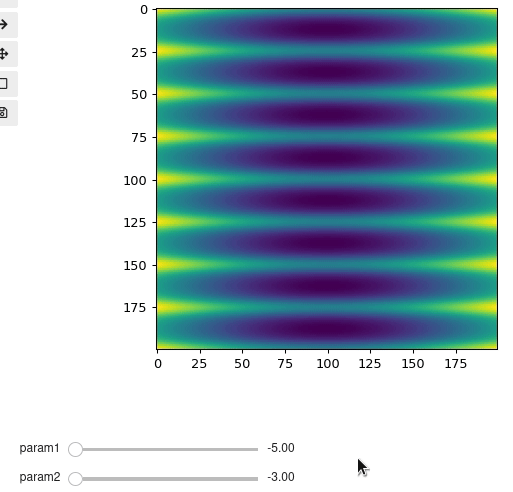
fig, ax = plt.subplots()
controls = iplt.imshow(f, param1=(-5, 5), param2=(-3, 12))
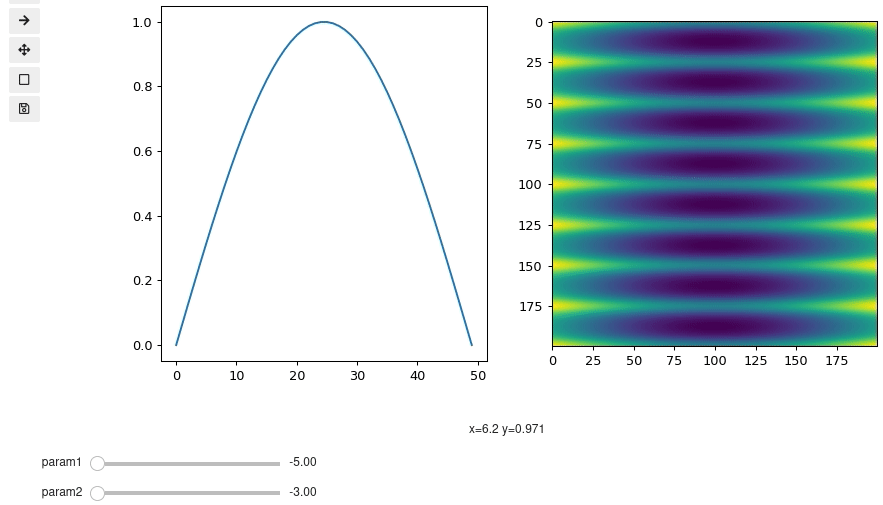
Providing an axis
You can also embed the interactive plot into an existing figure
[ ]:
fig, (ax1, ax2) = plt.subplots(1, 2, figsize=(10, 5))

ax1.plot(np.sin(np.linspace(0, np.pi)))
controls2 = iplt.imshow(f, param1=(-5, 5), param2=(-3, 12), ax=ax2)
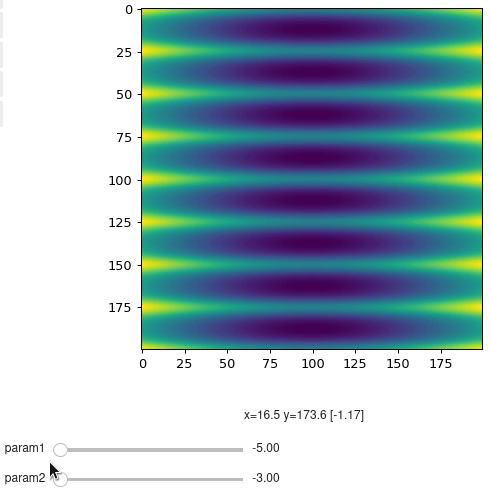
Preventing colormap autoscaling
The if you do not specify vmin/vmax and your function does not return an RGB(A) image then the default behavior is to rescale the colormap for each parameter change. This can disabled using this autoscale_cmap argument.
[ ]:
fig3, ax3 = plt.subplots()
controls3 = iplt.imshow(f, param1=(-5, 5), param2=(-3, 12), autoscale_cmap=False)
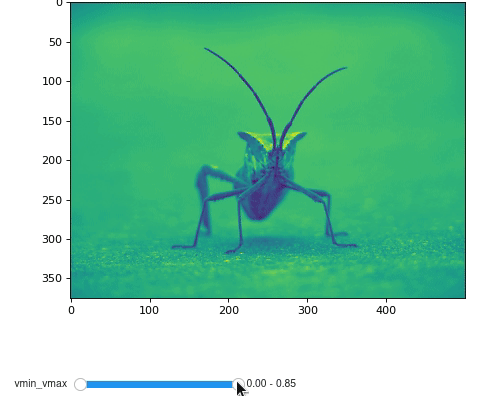
vmin and vmax: thresholding an image
Here we use the vmin_vmax argument along with the syntax for a RangeSlider to easily threshold the image. For more on how to use RangeSliders see their example page. Additionally you do not need to use a function to provide the image, you can also provide an array
[ ]:
img = plt.imread("https://matplotlib.org/3.3.1/_images/stinkbug.png")


fig4, ax4 = plt.subplots()
controls4 = iplt.imshow(img, vmin_vmax=("r", img.min(), img.max()))
[ ]: