Matplotlib Backends
Note
For discussion of what a Matplotlib backend is see: https://matplotlib.org/faq/usage_faq.html#what-is-a-backend
All of the functions in this library will work with any interactive backend to Matplotlib. However, if you are working in a Jupyter
Notebook then you should make sure to use the ipympl backend. If you are using a different backend
(such as qt5agg), then the built-in Matplotlib widgets will be used instead of the ipywidgets widgets. It is trickier to achieve a good
layout of Matplotlib widgets versus ipywidgets widgets, so if in a Notebook it is best to use the ipympl backend by including
the Jupyter Magic:
%matplotlib ipympl
Further options
If you want to use a non-ipympl backend in a Jupyter Notebook but still want ipywidgets style sliders then you have a few options.
With
interactive_plotandinteractive_histyou can passforce_ipywidgets=True
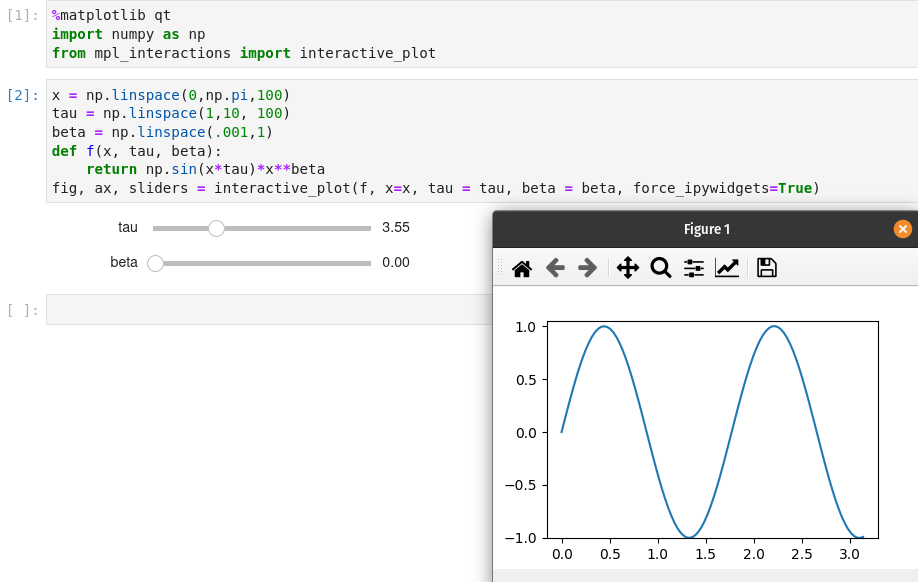
%matplotlib qt
import numpy as np
from mpl_interactions import interactive_plot

x = np.linspace(0,np.pi,100)
tau = np.linspace(1,10, 100)
beta = np.linspace(.001,1)
def f(x, tau, beta):
    return np.sin(x*tau)*x**beta
fig, ax, sliders = interactive_plot(f, x=x, tau = tau, beta = beta, force_ipywidgets=True)
This will result in sliders in the notebook, but the plot will be in a qt window:
You can also explicitly set whether to use Matplotlib sliders or not with the
use_ipywidgets
argument interactive_plot(). If None then the funciton will try to infer whether
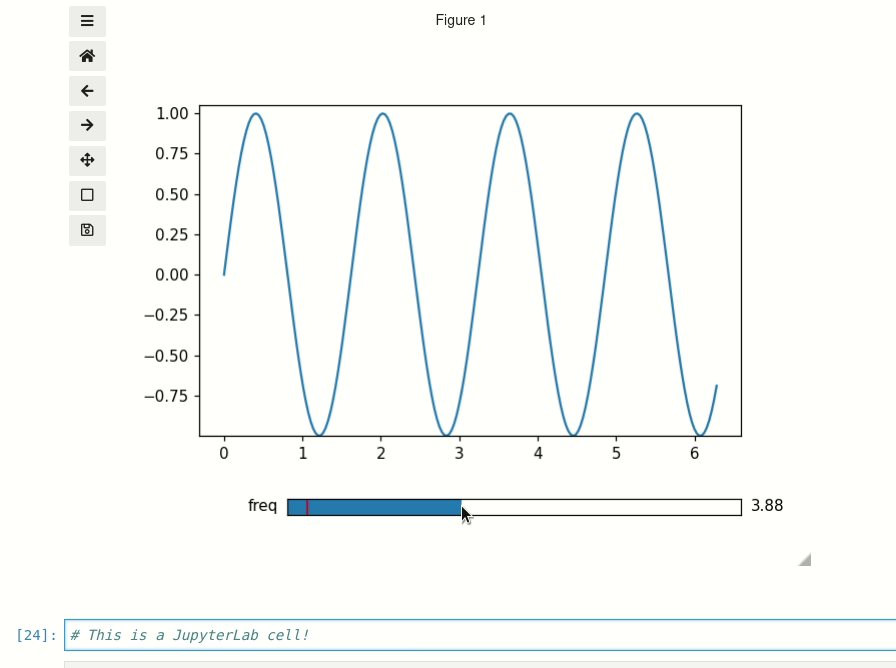
to use ipywidgets or not. By setting the argument to False then you will be able to use Matplotlib sliders in the notebook.
%matplotlib ipympl
import matplotlib.pyplot as plt
import numpy as np
from matplotlib.widgets import Slider
import mpl_interactions.ipyplot as iplt

fig, ax = plt.subplots()
plt.subplots_adjust(bottom=.25)
x = np.linspace(0,2*np.pi,200)
def f(x, freq):
    return np.sin(x*freq)
axfreq = plt.axes([0.25, 0.1, 0.65, 0.03])
slider = Slider(axfreq,label='freq', valmin=.05, valmax = 10)
controls = iplt.plot(x,f, freq=slider, use_ipywidgets=False, ax=ax)