Usage Guide
Basic Usage
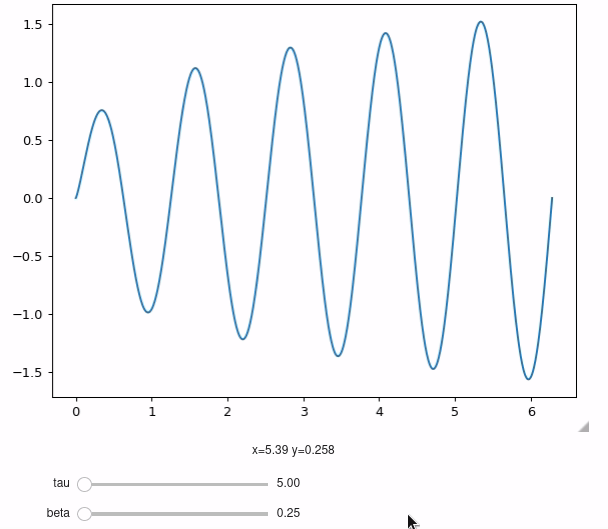
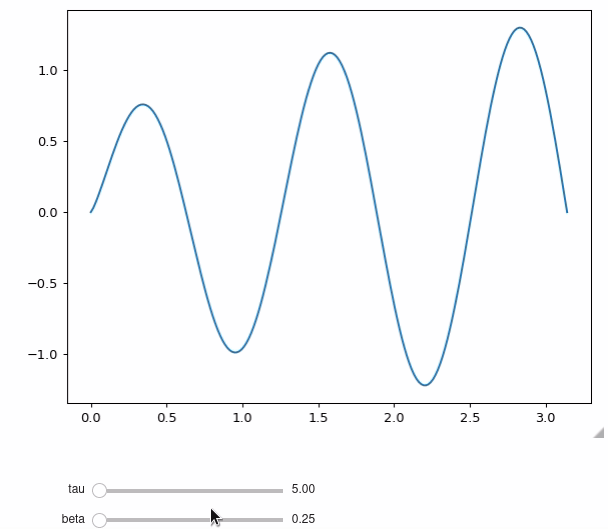
The mpl_interactions.pyplot module generalizes functions from matplotlib to be able to plot the results of a function rather than an array. So if we wanted to explore how the function
behaves as a function of \(\tau\) and \(\beta\). Normally to do this we would need to calculate \(f\) for multiple values of tau and beta and then plot multiple lines onto a plot.
With mpl_interactions we can plot the function and use sliders to control the values of \(tau\) of and \(beta\).
Note: For this first section we will use numpy arrays to specify what values tau and beta can have. But they can also be specified in a few other ways that may be more convenient - see the How to specify Parameters section below.
[ ]:
# imports
%matplotlib ipympl
import matplotlib.pyplot as plt
import numpy as np

import mpl_interactions.ipyplot as iplt
[ ]:
# define the function
def f(x, tau, beta):
    return np.sin(x * tau) * x ** beta


x = np.linspace(0, 2 * np.pi, 1000)
tau = np.linspace(5, 10)
beta = np.linspace(0.25, 1)
[ ]:
# make the interactive figure

fig, ax = plt.subplots()
controls = iplt.plot(x, f, tau=tau, beta=beta)
The interactive functions behave as closely to their Matplotlib equivalents as possible. So all of these are valid calls:
controls1 = iplt.plot(f, tau=tau, beta=beta)
controls2 = iplt.plot(f, 'o--', tau=tau, beta=beta)
controls3 = iplt.plot(x, f, tau=tau, beta=beta)
controls4 = iplt.plot(x, f, 'o--', tau=tau, beta=beta)
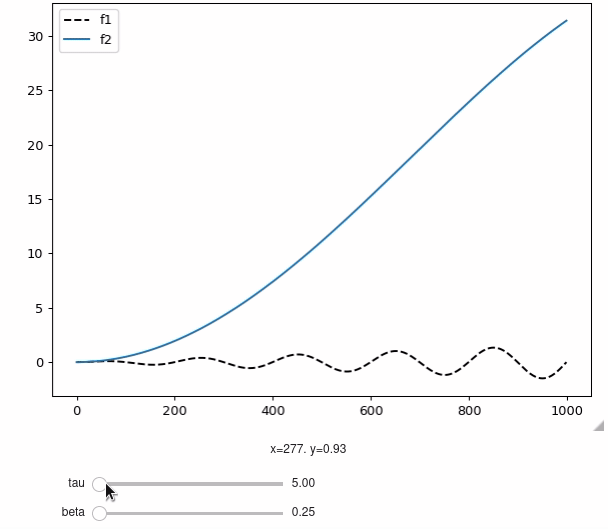
However, if you run all three of those lines together then you will create three sets of controls. To have sliders affect multiple lines you can pass the controls to the function instead of using keyword arguments.
[ ]:
fig, ax = plt.subplots()


def f1(tau, beta):
    return np.sin(x * tau) * x * beta


def f2(tau, beta):
    return np.sin(x * beta) * x * tau


controls = iplt.plot(f1, "k--", tau=tau, beta=beta, label="f1")
iplt.plot(f2, controls=controls, label="f2")
_ = plt.legend()
Only Using some of the parameters + specifying axes
Sometimes you may want to use one controls object for multiple functions but the functions take different arguments. There are two ways you can use the same controls object to control functions with different signatures.
Progressively add arguments
If you provide both a kwarg and a
controlsobject to an interactive plotting function then the
Index the controls object to select only the parameters you want.
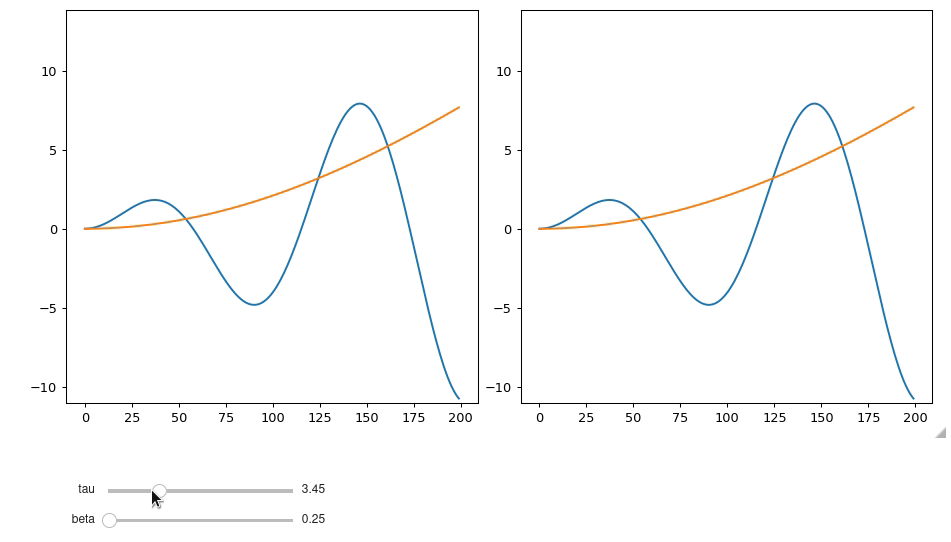
This example also shows how to choose what axis the plot shows up on. If you do not specify the ax argument then the function will plot on the current axis in the same way that that Matplotlib works.
[ ]:
def f1(tau):
    return np.sin(x * tau) * x * tau


def f2(tau, beta):
    return np.sin(x * beta) * x * tau


fig, (ax1, ax2) = plt.subplots(ncols=2, figsize=(10, 4.8))

# approach 1: adding extra kwargs
controls = iplt.plot(f1, tau=tau, ax=ax1)
_ = iplt.plot(f2, controls=controls, beta=beta, ax=ax1)

# approach 2: Indexing the controls object

iplt.plot(f1, controls=controls["tau"], ax=ax2)
_ = iplt.plot(f2, controls=controls, ax=ax2)
Combining Multiple types of Plots
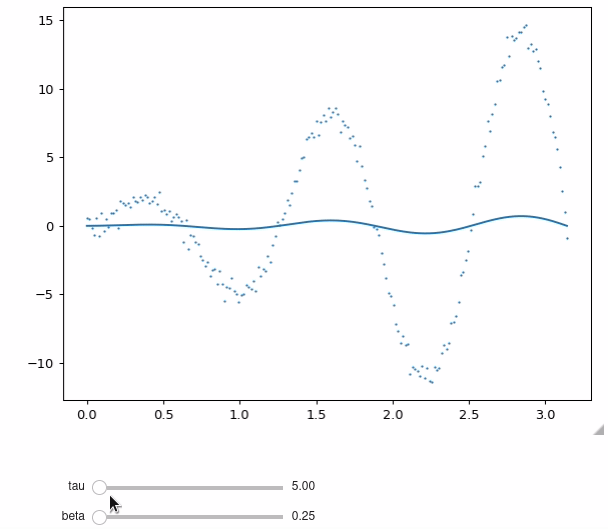
You are not limited to only using the plot function - or to only using one type of interactive plot in a single graph. You can mix and match them as you please.
[ ]:
x = np.linspace(0, np.pi, 200)


def f_line(x, tau, beta):
    return np.sin(x * tau) * x * beta


def f_scatter(x, tau):
    return np.sin(x * tau) * x * tau + np.random.randn(len(x)) * 0.5


fig, ax = plt.subplots()
controls = iplt.plot(x, f_line, tau=tau, beta=beta)
_ = iplt.scatter(x, f_scatter, s=0.5, controls=controls["tau"])
How to Specify Parameters
In the above example we specified the possible values for tau and beta by passing in a numpy array. However, you are not limited to giving numpy arrays to create sliders. You can also use:
Tuples
Will be passed as an argument to np.linspace and that resulting array will be used as the slider values.
n.b. If you use Matplotlib sliders instead of ipywidgets sliders then tuples of length will just be used to define the max and min value of the slider as Matplotlib sliders do not require
[ ]:
fig, ax = plt.subplots()
controls = iplt.plot(x, f, tau=(5, 10, 5), beta=(0.25, 1))
Categoricals
If you pass a parameter as a python set then the categorical selection widget will be created rather than a slider. One thing to be aware of is that sets are unordered in Python, so if you want to maintain the ordering you can pass in values defined with a set containing a single tuple: {(<option 1>, <option 2>)}
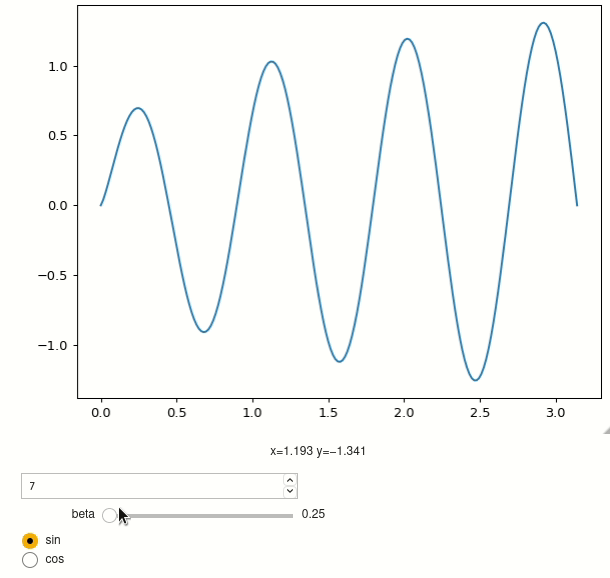
Existing widgets
You can also use existing widgets from either Matplotlib or ipywidgets.
[ ]:
import ipywidgets as widgets


def f(x, tau, beta, type_):
    if type_ == "sin":
        return np.sin(x * tau) * x ** beta
    elif type_ == "cos":
        return np.cos(x * tau) * x ** beta


tau = widgets.FloatText(value=7, step=0.1)
fig, ax = plt.subplots()
controls = iplt.plot(x, f, tau=tau, beta=(0.25, 1), type_={("sin", "cos")})
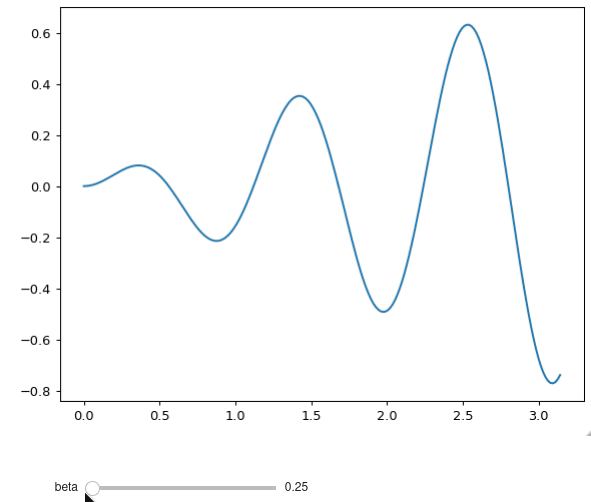
Fixed Parameters
You may want to pin the value of some parameters but not others. There are two ways to accomplish this.
Pass a scalar
Use
ipywidgets.fixed
So to fix tau to 5.61:
[ ]:
fig, ax = plt.subplots()


def f(x, tau, beta):
    return np.sin(x * tau) * x * beta


tau = 5.61
# tau = ipywidgets.fixed(5.61)
controls = iplt.plot(x, f, tau=tau, beta=(0.25, 1))
Styling
Axis scaling
You can control how the xlim/ylim behaves using the xlim/ylim arguments. The options are: 1. 'stretch' - The default; allows the x/y axes to expand but never shrink 2. 'auto' - Autoscales the limits for every plot update 3. 'fixed' - Never automatically update the limits 4. [float, float] - This value will be passed through to plt.xlim or plt.ylim
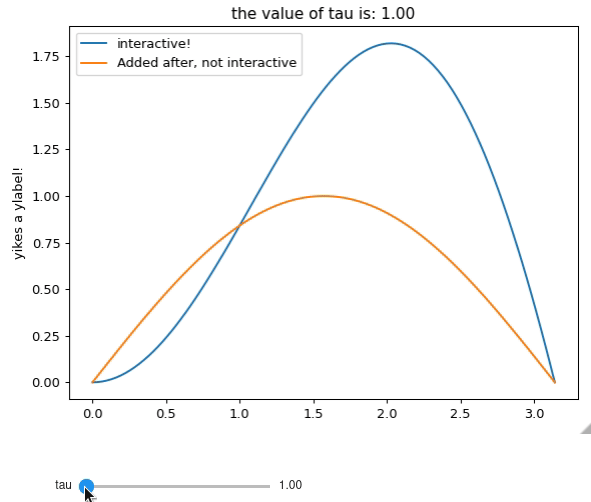
Reference parameters values in the Title
You can make the Title automatically update with information about the values by using title argument. Use the name of one of the parameters as a format specifier in the string. For example use the following title string will put value of tau in the title and round it to two decimals: '{'tau:.2f}'
[ ]:
x_ = np.linspace(0, np.pi, 100)
tau = np.linspace(1, 10, 100)


def f_x(tau):
    return x_


def f_y(x, tau):
    return np.sin(x * tau) * x


fig, ax = plt.subplots()
controls = iplt.plot(
    f_x,
    f_y,
    tau=tau,
    xlim="stretch",
    ylim="auto",
    title="the value of tau is: {tau:.2f}",
    label="interactive!",
)

# you can still use plt commands if this is the active figure
plt.ylabel("yikes a ylabel!")

# you can new lines - though they won't be updated interactively.
plt.plot(x, np.sin(x), label="Added after, not interactive")

_ = plt.legend()
Embedding the controls into a larger layout
If you are using ipywidgets then you can incorporate the controls object into an AppLayout or VBox or other ipywidgets layout tool by using controls.vbox which is an ipywidget and thus can be included in the layout.
For matplotlib sliders the controls object stores a list of all the figures it uses for controls in controls.control_figures
[ ]: