Matplotlib Backends#
Note
For discussion of what a Matplotlib backend is see: https://matplotlib.org/faq/usage_faq.html#what-is-a-backend
All of the functions in this library will work with any interactive backend to Matplotlib. However, if you are working in a Jupyter Notebook then you should make sure to use the ipympl backend. If you are using a different backend (such as qt5agg), then the built-in Matplotlib widgets will be used instead of the ipywidgets widgets. It is trickier to achieve a good layout of Matplotlib widgets versus ipywidgets widgets, so if in a Notebook it is best to use the ipympl backend by including the Jupyter Magic:
%matplotlib ipympl
Further options#
If you want to use a non-ipympl backend in a Jupyter Notebook but still want ipywidgets style sliders then you have a few options.
With
interactive_plot()andinteractive_hist()you can passforce_ipywidgets=True:%matplotlib qt import numpy as np from mpl_interactions import interactive_plot x = np.linspace(0,np.pi,100) tau = np.linspace(1,10, 100) beta = np.linspace(.001,1) def f(x, tau, beta): return np.sin(x*tau)*x**beta fig, ax, sliders = interactive_plot(f, x=x, tau = tau, beta = beta, force_ipywidgets=True)
This will result in sliders in the notebook, but the plot will be in a
qtwindow: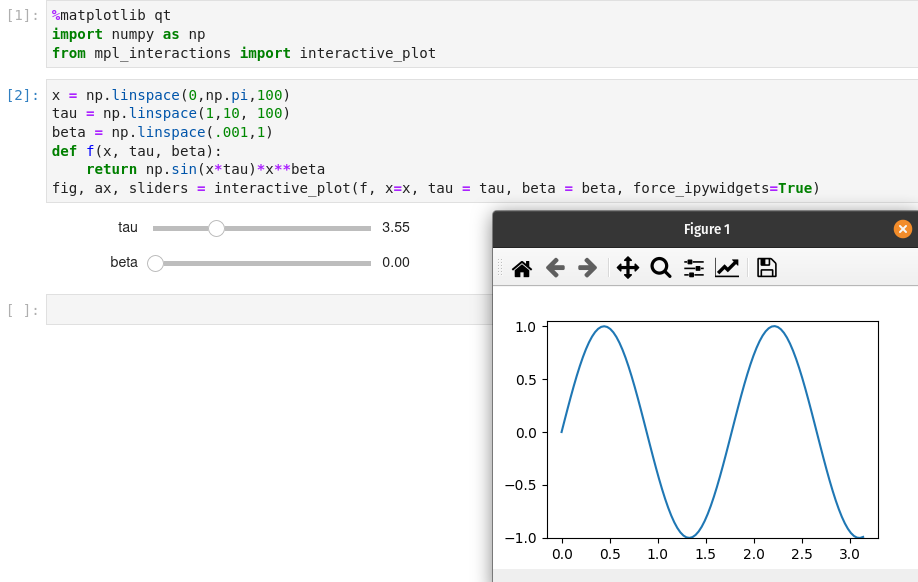
You can also explicitly set whether to use Matplotlib sliders or not with the
use_ipywidgetsargument ininteractive_plot(). IfNonethen the function will try to infer whether to use ipywidgets or not. By setting the argument toFalse, you will be able to use Matplotlib sliders in the notebook.%matplotlib ipympl import matplotlib.pyplot as plt import numpy as np from matplotlib.widgets import Slider import mpl_interactions.ipyplot as iplt fig, ax = plt.subplots() plt.subplots_adjust(bottom=.25) x = np.linspace(0,2*np.pi,200) def f(x, freq): return np.sin(x*freq) axfreq = plt.axes([0.25, 0.1, 0.65, 0.03]) slider = Slider(axfreq,label='freq', valmin=.05, valmax = 10) controls = iplt.plot(x,f, freq=slider, use_ipywidgets=False, ax=ax)