Saving Animations#
Since the controls object knows how to update figures as the sliders change their values it is also able to save an animation (e.g. .gif or .mp4 by updating the slider values for you. Under the hood this makes use of FuncAnimation and you can pass any relevant kwargs in via func_anim_kwargs. Other kwargs will passed to Animation.save.
Saving animations will work with either ipywidgets Sliders or with matplotlib Sliders. However, it will not work with other widgets. (This is an potential area of improvement, PRs welcome)
%matplotlib ipympl
import matplotlib.pyplot as plt
import numpy as np

import mpl_interactions.ipyplot as iplt
Basic Usage#
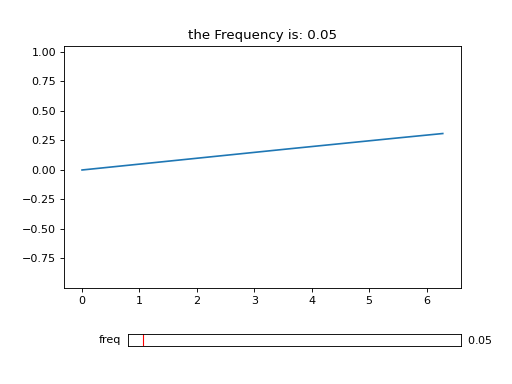
x = np.linspace(0, 2 * np.pi, 200)


def f(x, amp, freq):
    return amp * np.sin(x * freq)


# Create the plot as normal
fig, ax = plt.subplots()
controls = iplt.plot(x, f, freq=(0.05, 10, 250), amp=(1, 10))
_ = iplt.title("the Frequency is: {freq:.2f}", controls=controls["freq"])
# save as a gif
anim = controls.save_animation("freq-plot-1.gif", fig, "freq", interval=35)
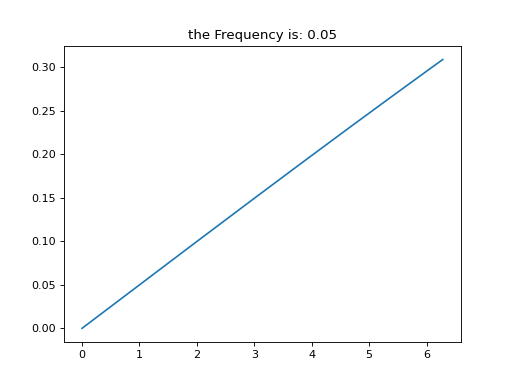
Which Generates this GIF#
Embeding the animation in a noteook.#
To embed the animation you can do:
Link to it in markdown cell with
Drag the file into a markdown cell
Embed
Animation.to_html5_videousingIPython.display.Video:from IPython.display import Video Video(anim.to_html5_video(), embed=True)
Use IPython to display the saved gif
You can also read more in this excellent blog post: http://louistiao.me/posts/notebooks/embedding-matplotlib-animations-in-jupyter-as-interactive-javascript-widgets
# NBVAL_IGNORE_OUTPUT
from IPython.display import Image

Image("freq-plot-1.gif")
Matplotlib Sliders with valstep=None#
Matplotlib sliders have an optional attribute valstep that allows for discrete slider steps. mpl_interactions uses this for all sliders that it creates, however if you passed a custom made slider in as a kwarg you may not have used valstep if this is the case then the save_animation() method cannot infer how many frames it should render, so you can specify this with the N_frames arguments.
from matplotlib.widgets import Slider

import mpl_interactions.ipyplot as iplt

fig, ax = plt.subplots()
plt.subplots_adjust(bottom=0.25)
x = np.linspace(0, 2 * np.pi, 200)


def f(x, freq):
    return np.sin(x * freq)


axfreq = plt.axes([0.25, 0.1, 0.65, 0.03])
slider = Slider(axfreq, label="freq", valmin=0.05, valmax=10)  # note the lack of valstep
controls2 = iplt.plot(x, f, freq=slider, ax=ax)
_ = iplt.title("the Frequency is: {freq:.2f}", controls=controls2["freq"])
# save as a gif
anim2 = controls2.save_animation("freq-plot-2.gif", fig, "freq", interval=35, N_frames=100)
Gives this GIF:#