Using Matplotlib Widgets#
Warning
When using Matplotlib widgets, you need to make sure you always keep a reference to the control sliders, otherwise the callbacks will be garbage collected and cease to work.
This page is dedicated to showing how to use the interactive_* functions—such as interactive_plot()—with Matplotlib widgets. For a more general discussion of how to use the ipyplot submodule, see Usage Guide.
Differences from ipywidgets sliders#
1. mpl-sliders are different from ipywidgets sliders in that they will only take a min and and max with an optional step, while for ipywidgets sliders you need to specify all values (at least until version 8). A consequence of this is that the various interactive_* methods will only use the first two values of any tuples passed as a parameter (i.e. they will ignore the num argument to numpy.linspace()).
2. Laying out Matplotlib widgets is significantly more difficult than laying out elements in a web browser. If you pass an existing Matplotlib widget a parameter then the plot will update as expected; however, the interactive_* methods will not display it for you. Alternatively, when using ipywidgets widgets, if you give a widget as a parameter
it will be included in the display of the controls created by the function.
Basic example#
If you are not using the ipympl backend, then mpl_interactions will automatically create a new figure to hold all the controls.
# NBVAL_SKIP
# setting the backend in case this is run in a notebook
%matplotlib qt
import matplotlib.pyplot as plt
import numpy as np

import mpl_interactions.ipyplot as iplt

x = np.linspace(0, np.pi, 100)
tau = np.linspace(1, 10, 100)
beta = np.linspace(0.001, 1)


def f(x, tau, beta):
    return np.sin(x * tau) * x**beta


fig, ax = plt.subplots()
controls = iplt.plot(x, f, tau=tau, beta=beta, slider_formats={"beta": "{:.3e}"})
plt.show()
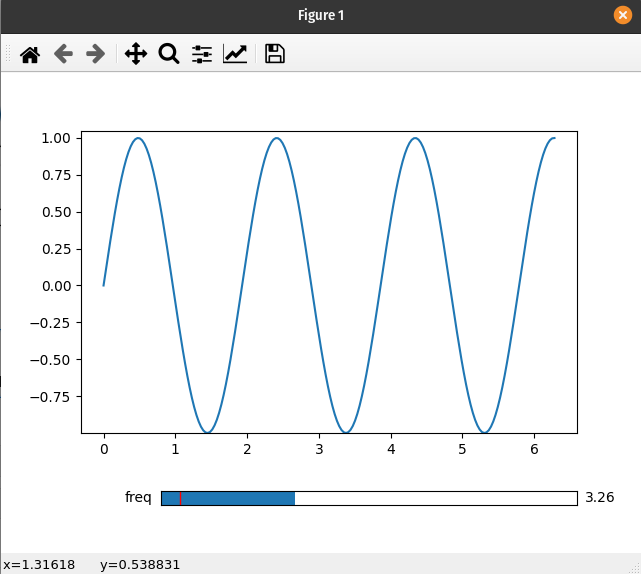
Custom positioning of Matplotlib widgets#
There does not seem to be a consistent and simple way to layout Matplotlib widgets in the same figure as the controlled plot.
To address this, mpl_interactions will open a new figure to place all the controls.
If you would like the sliders and the plot to live in the same figure, you will need to create and position your own slider widget.
import matplotlib.pyplot as plt
import numpy as np
from matplotlib.widgets import Slider

import mpl_interactions.ipyplot as iplt

fig, ax = plt.subplots()
plt.subplots_adjust(bottom=0.25)
x = np.linspace(0, 2 * np.pi, 200)


def f(x, freq):
    return np.sin(x * freq)


axfreq = plt.axes([0.25, 0.1, 0.65, 0.03])
slider = Slider(axfreq, label="freq", valmin=0.05, valmax=10)
controls = iplt.plot(x, f, freq=slider, ax=ax)
plt.show()